Ticker Teardown Dossier
Micron ($MU), taken apart the way the desk does.
Micron (MU) Teardown Dossier · As of 2026-11-02, refreshed after FQ4 2026 results
The MU dossier is the desk's Micron teardown written out as a document, plus what a five-minute video cannot carry: the last eight quarters of Micron's own SEC filings in one table (fiscal years for a foreign filer whose quarterly reports carry no structured data), a peer comparison with numbers, the level map rebuilt from the latest close, and a link to every filing used. Rebuilt after each quarterly print.
Look inside before you buy
1,943 words · about 8 min to read · 10 sections · data as of 2 November 2026 · last refreshed after FQ4 2026 results
Table of contents
- What is in this dossier
- What this is not
- 1. The teardown
- The setup
- The print: fiscal q4 2026
- The guide: next quarter
- The cash: the line most miss
- The price: our arithmetic
- The bear case: the cycle
- The bear case: the tape says peak
- The tape: today's close
- The level: be honest
- The verdict: not confirmed
- 2. What changed since it was written
- 3. The filings: the last eight quarters
- 4. Valuation against the peers
- 5. Level map
- 6. Sources
- 7. What this dossier cannot do
- More dossiers in this theme
Excerpt
1. The teardown
Written 2026-09-30, with prices as of 2026-09-30. Figures in this part are as the desk read them that day; parts 2 to 5 carry the numbers as of 2026-11-02.
The setup
Micron just reported $54 billion of revenue in one quarter, almost 5x a year ago. Yet this summer the stock fell 39% in five weeks, and it still closed on 30 September 12% under its June high. Is this a memory cycle at its peak, or a new business the market refuses to pay for?
The print: fiscal q4 2026
Start with the print, from the 30 September filing. Fiscal fourth quarter revenue: $54.23 billion, against $11.32 billion a year ago. Micron had guided $50 billion, plus or minus $1 billion, so it beat the top by $3 billion. Gross margin, non GAAP: 87%. Earnings per share: $33.42, against $31 guided. The full year: $133 billion.
The guide: next quarter
Then the guide, which is what the stock trades on. For the next quarter, Micron guides $61.5 billion of revenue, plus or minus $1.5 billion, near 86% gross margin, $38.15 of earnings per share. Another 13% step, from a record base. Core data center alone went from $11.5 billion to $18 billion in one quarter.
The cash: the line most miss
The line most people will miss is on the balance sheet. This year customers paid Micron $12.7 billion of deposits, up front, for supply they have not received. That is what the strategic customer agreements look like in cash. Add $33 billion of adjusted free cash flow in the quarter, and Micron holds $73.5 billion of cash and investments, against about $5 billion of debt.
One table from the document
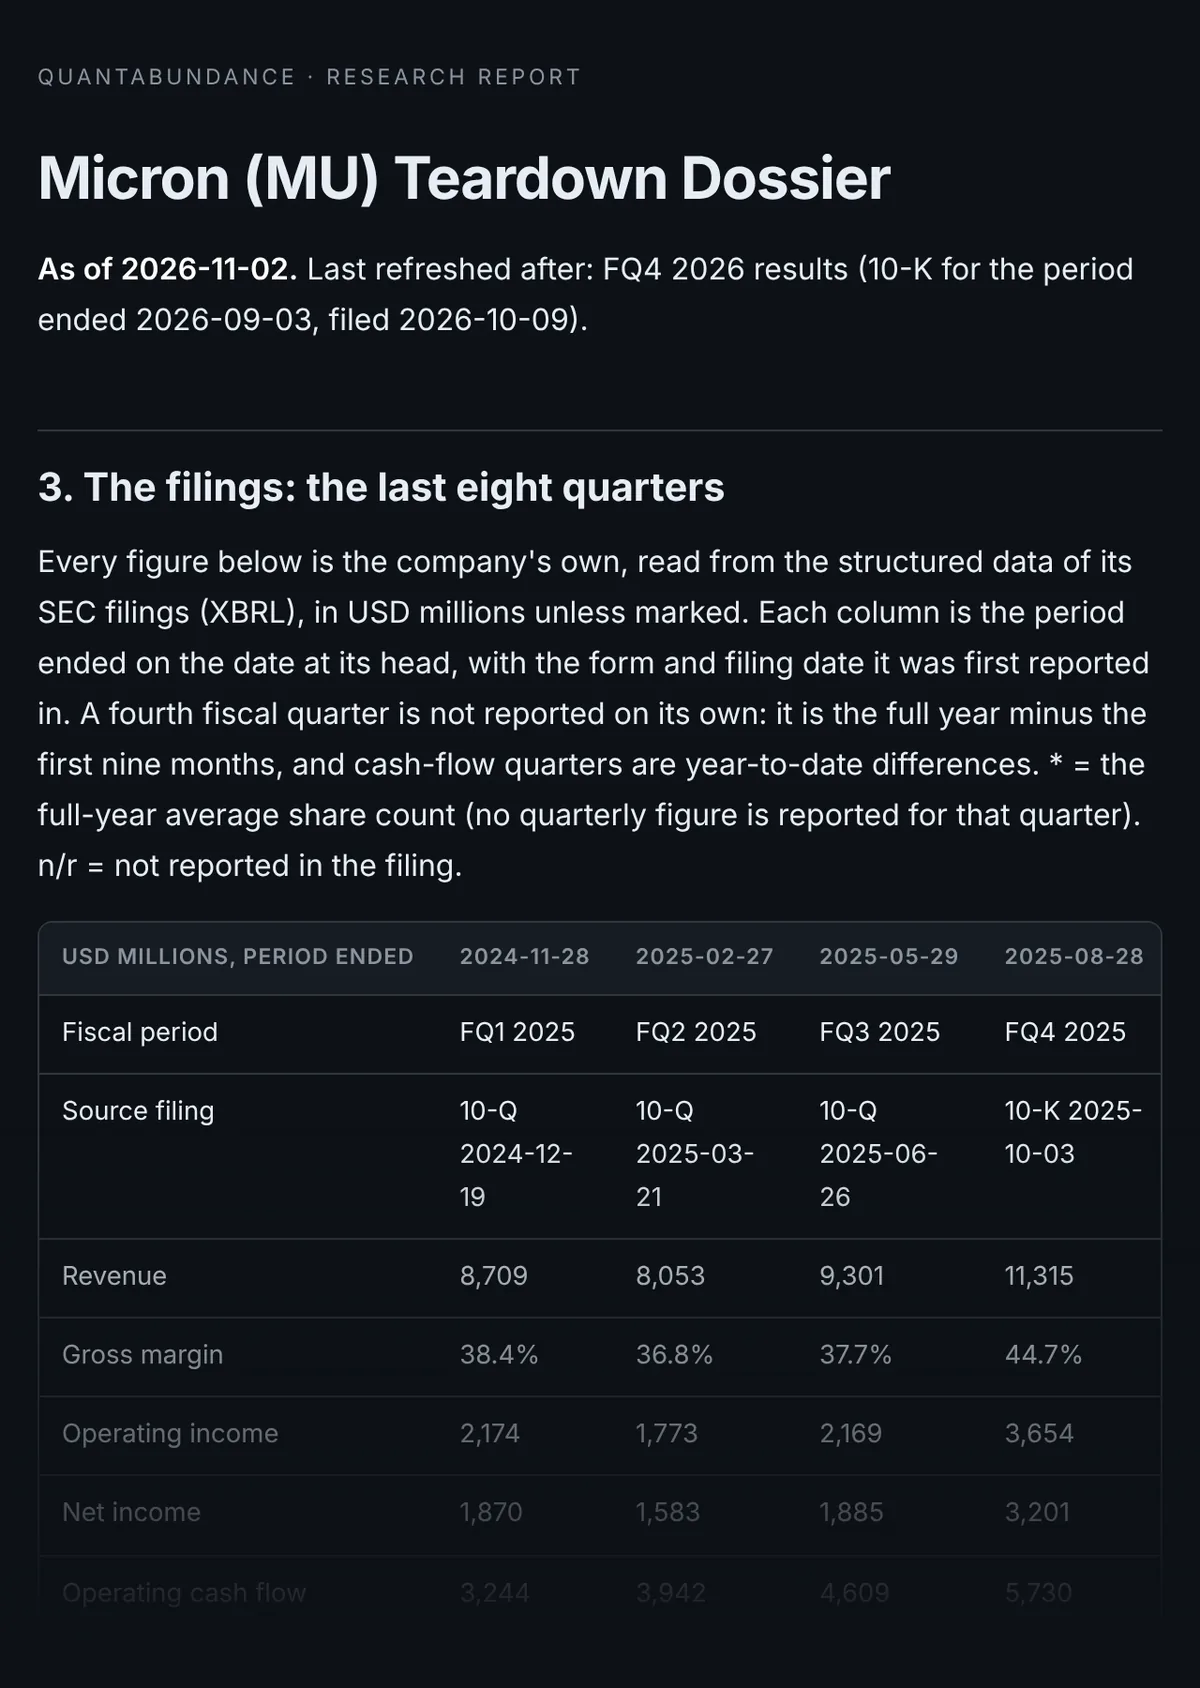
3. The filings: the last eight quarters
| USD millions, period ended | 2024-11-28 | 2025-02-27 | 2025-05-29 | 2025-08-28 | 2025-11-27 | 2026-02-26 | 2026-05-28 | 2026-09-03 |
|---|---|---|---|---|---|---|---|---|
| Fiscal period | FQ1 2025 | FQ2 2025 | FQ3 2025 | FQ4 2025 | FQ1 2026 | FQ2 2026 | FQ3 2026 | FQ4 2026 |
| Source filing | 10-Q 2024-12-19 | 10-Q 2025-03-21 | 10-Q 2025-06-26 | 10-K 2025-10-03 | 10-Q 2025-12-18 | 10-Q 2026-03-19 | 10-Q 2026-06-25 | 10-K 2026-10-09 |
| Revenue | 8,709 | 8,053 | 9,301 | 11,315 | 13,643 | 23,860 | 41,456 | 54,229 |
| Gross margin | 38.4% | 36.8% | 37.7% | 44.7% | 56.0% | 74.4% | 84.6% | 86.8% |
| Operating income | 2,174 | 1,773 | 2,169 | 3,654 | 6,136 | 16,135 | 33,318 | 43,751 |
| Net income | 1,870 | 1,583 | 1,885 | 3,201 | 5,240 | 13,785 | 28,243 | 37,701 |
| Operating cash flow | 3,244 | 3,942 | 4,609 | 5,730 | 8,411 | 11,903 | 25,388 | 43,973 |
| Capex | -3,206 | -4,055 | -2,938 | -5,658 | -5,389 | -6,387 | -7,826 | -11,110 |
| Free cash flow | 38.0 | -113.0 | 1,671 | 72.0 | 3,022 | 5,516 | 17,562 | 32,863 |
| Cash and equivalents | 6,693 | 7,552 | 10,163 | 9,642 | 9,731 | 13,908 | 24,995 | 38,364 |
| Debt (book, excl. leases) | 11,306 | 11,541 | 12,434 | 11,533 | 8,844 | 10,142 | 5,722 | 2,792 |
| Diluted shares (M) | 1,122 | 1,123 | 1,125 | 1,125* | 1,138 | 1,142 | 1,145 | 1,143* |
The preview stops here. The full document is delivered by email after purchase.
Questions about $MU? Ask the research assistant.
It reads our $MU data (thesis, key levels, peers, a year of prices) and any chart screenshot you paste, then explains the setup in plain English. Free with an email login, 5 questions a day. Education only: it never tells you to buy or sell, and it can be wrong, so check the numbers.
What the dossier has that the video does not
The filings themselves: revenue, gross margin, operating income, net income, operating cash flow, capex, free cash flow, cash, debt and diluted shares, quarter by quarter, each column dated with the filing it comes from. A foreign filer whose quarterly reports carry no structured data gets its fiscal years, and the dossier says so.
Never stale
Every dossier carries an "as of" date and the quarter it was last refreshed after. It is rebuilt after each print, and the desk's daily check flags any dossier left more than 45 days without a refresh. The written teardown keeps its date, and a "what changed since" section gives the move in the price and the filings since.
What is inside
- The teardown in writing: the business, the bull case, the full bear case and the verdict, dated.
- What changed since it was written: the price move and every SEC filing since.
- Eight quarters of the company's own SEC filings in one table, each column dated, with a plain read of what the table says.
- Peers with numbers: market cap, revenue growth, operating margin, EV / sales and distance from the 52-week high.
- The level map rebuilt from the latest close: where the price sits against the 52-week range and each level.
- Sources: a link to every filing and results release used.
Buy it if
- You hold or watch $MU and want a structured read before acting.
- You want levels you can check on the chart, not an opinion.
Skip it if
- You want a buy signal. A dossier explains and maps; it does not signal.
- You want every name on the desk. The Teardown Library covers every dossier, current and future, for less than four dossiers.
How delivery works
Pay through Stripe, and the document arrives by email within seconds as a permanent link tied to your address. Read it in the browser or print it to PDF. Nothing to install, nothing recurring: a one-time purchase. Lost the email? Sign in to your library with the same address and it is there.
Included in Pro. See Pro
An educational research publication, not investment advice, trade signals, a managed account, or an advisory service. Nothing in it is a recommendation to buy or sell any security. See our disclosures.