Token Dossier
Pi Network ($PI), taken apart the way the desk does.
Pi Network (PI) Token Dossier · Token edition, as of 2026-11-22
The PI dossier is the desk's Pi Network teardown written out as a document, with the figures a short video cannot hold in one place: the token in numbers, the supply in circulation against the total and the maximum, the protocol's fees and revenue where they are tracked, and the level map rebuilt from the latest price. A token files no quarterly report, so this is a shorter document than a stock dossier, and it is priced as such.
Look inside before you buy
1,549 words · about 7 min to read · 12 sections · data as of 22 November 2026
Table of contents
- What is in this dossier
- What this is not
- 1. The teardown
- The setup
- What it is
- The supply
- The flow
- What absorbs it
- The users
- The summit: november 17
- The risks
- The chart: Saturday's close
- The verdict
- 2. What changed since it was written
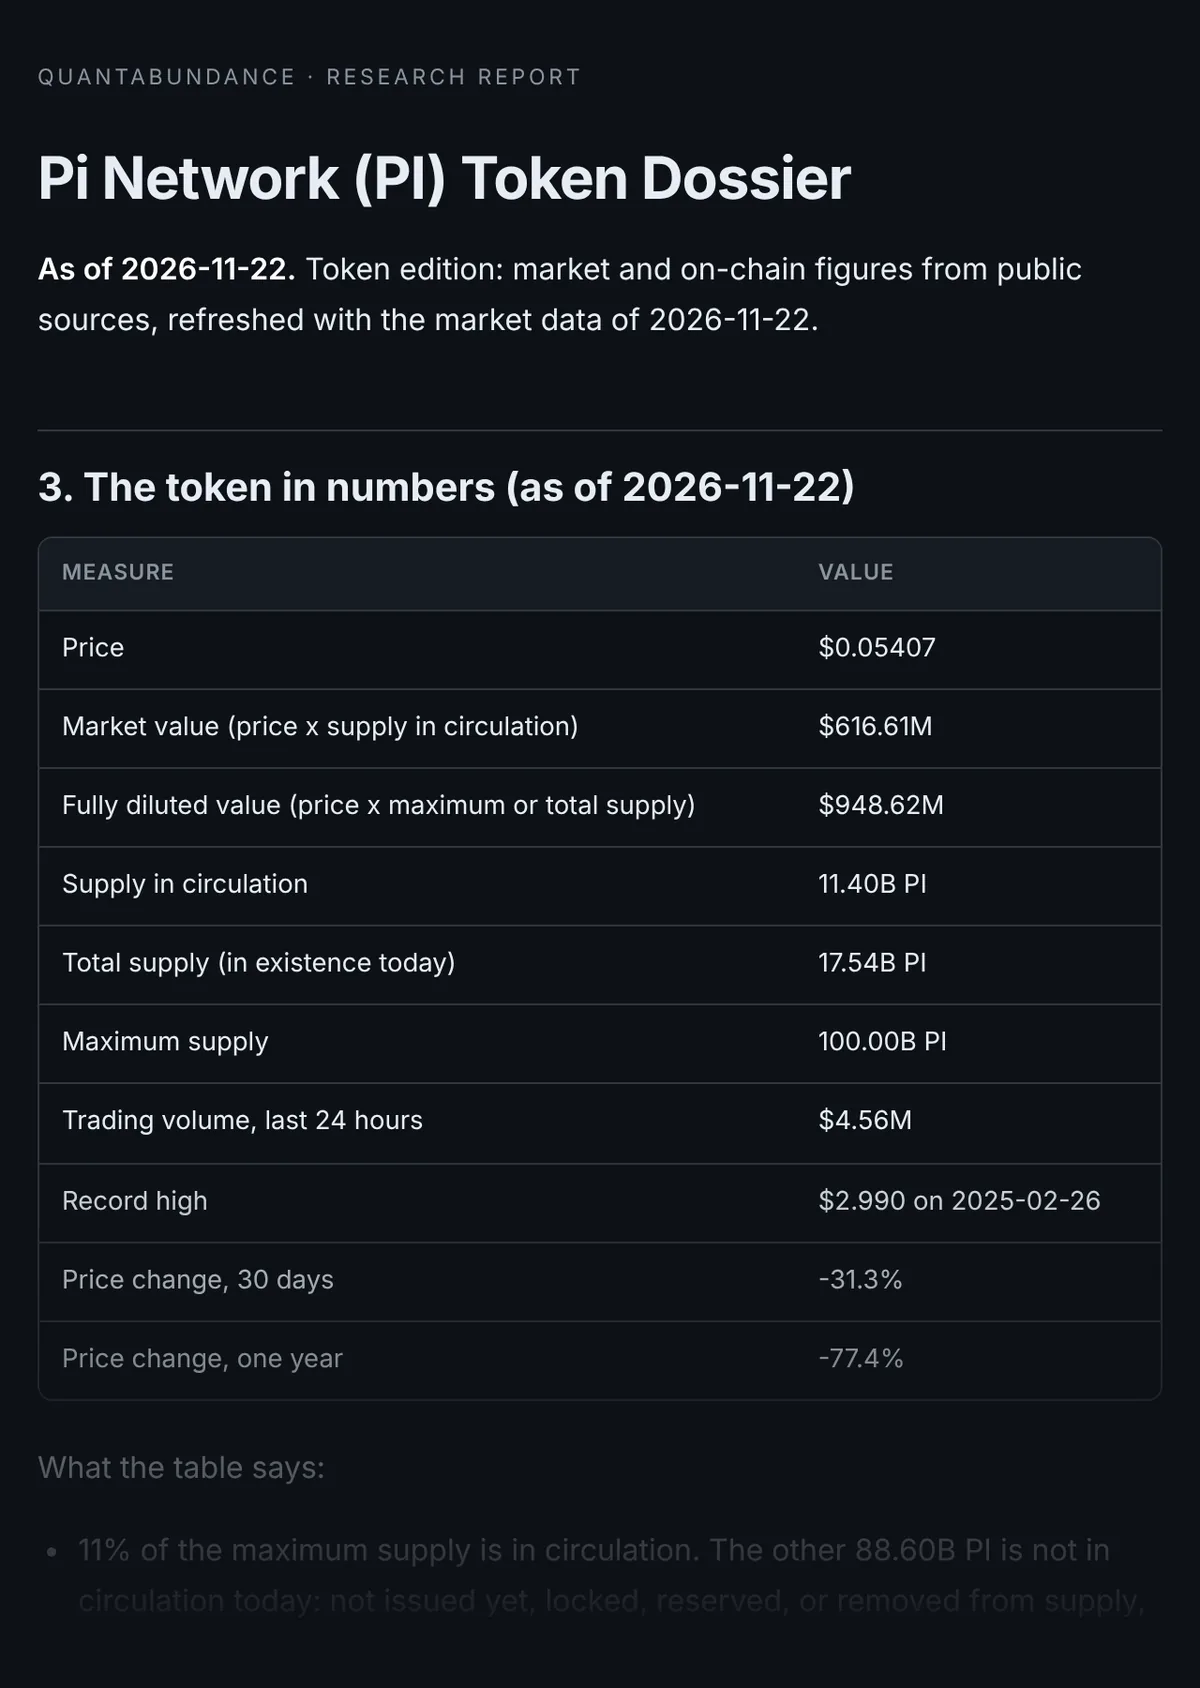
- 3. The token in numbers (as of 2026-11-22)
- 4. The supply over twelve months
- 5. Against Bitcoin and Ether
- 6. How far it falls when it falls
- 7. The level map (as of 2026-11-22)
- 8. Sources
- 9. What this dossier cannot do
- More dossiers in this theme
Excerpt
1. The teardown
Written 2026-11-22, with prices as of 2026-11-22. Figures in this part are as the desk read them that day; parts 2 to 5 carry the numbers as of 2026-11-22.
The setup
Pi Network has 100 billion coins in its design. Only 11.4% of them circulate today. And on Friday, Pi closed at its lowest level of the year, 98% under its record. As the rest of the supply comes out, who absorbs it? Pi closed Saturday at 5.18 cents. The answer, and the levels that settle it, come before the end.
What it is
It began in 2019 as a phone app. Users tapped a button each day and earned Pi, a kind of mining with no special hardware. The network runs on a version of the Stellar consensus protocol. Its open mainnet launched on February 20, 2025, and that is when Pi could first move to exchanges.
The supply
CoinGecko counts 11.4 billion Pi in circulation. The total supply created so far is 17.5 billion. The maximum is 100 billion. Per Pi's own allocation, as summarized by CoinDCX, 65 billion are set for mining rewards, and 20 billion for the core team.
The flow
The flow. Pi has no single unlock date. Coins enter circulation as users pass identity checks and move their balance to the mainnet. The tracker TokenToria estimates 200 to 300 million Pi a month. At Saturday's close, 250 million Pi is about $13 million of new supply a month.
One table from the document
5. Against Bitcoin and Ether
| Period | PI | Bitcoin | Ether |
|---|---|---|---|
| 30 days | -31.0% | -25.2% | -28.1% |
| 90 days | -39.4% | -23.2% | -30.9% |
| One year | -77.5% | -30.1% | -38.8% |
The preview stops here. The full document is delivered by email after purchase.
What the dossier has that the video does not
One dated table for the token: price, market value, fully diluted value, supply in circulation, total and maximum supply, volume and the record high, with a plain read of what the table says. Where a data provider tracks the protocol, its fees and revenue over 30 days and one year, and how many times annualised fees the token trades at, said as an estimate.
Kept current
The dossier carries an "as of" date. The tables are rebuilt on a regular schedule and the desk's daily check flags any dossier left more than 45 days without a refresh. The written teardown keeps its date, and a line says how far the price has moved since.
What is inside
- The teardown in writing: what the token is, who earns it, the weak points and the verdict, dated.
- What changed since it was written: the price then and now.
- The token in numbers: market value, fully diluted value, supply in circulation, total and maximum supply, with a plain read.
- Fees and revenue of the protocol over 30 days and one year, where a public data provider tracks them.
- The level map rebuilt from the latest price: the 52-week range and the 50 and 200-day averages.
- Sources: a link to every data page used.
Buy it if
- You hold or watch $PI and want a structured read before acting.
- You want figures you can check yourself, not an opinion.
Skip it if
- You want a buy signal. A dossier explains and maps; it does not signal.
- You expect audited accounts. A token has none: the figures come from public data providers and are labelled as such.
How delivery works
Pay through Stripe, and the document arrives by email within seconds as a permanent link tied to your address. Read it in the browser or print it to PDF. Nothing to install, nothing recurring: a one-time purchase. Lost the email? Sign in to your library with the same address and it is there.
Included in Pro. See Pro
An educational research publication, not investment advice, trade signals, a managed account, or an advisory service. Nothing in it is a recommendation to buy or sell any security. See our disclosures.