Token Dossier
Stellar ($XLM), taken apart the way the desk does.
Stellar (XLM) Token Dossier · Token edition, as of 2026-11-13
The XLM dossier is the desk's Stellar teardown written out as a document, with the figures a short video cannot hold in one place: the token in numbers, the supply in circulation against the total and the maximum, the protocol's fees and revenue where they are tracked, and the level map rebuilt from the latest price. A token files no quarterly report, so this is a shorter document than a stock dossier, and it is priced as such.
Look inside before you buy
1,488 words · about 6 min to read · 10 sections · data as of 13 November 2026
Table of contents
- What is in this dossier
- What this is not
- 1. The teardown
- The setup
- What it is
- The usage: q3 report
- What it earns
- The coin
- The supply
- The seller
- The risks
- The chart: Tuesday's close
- The verdict
- 2. What changed since it was written
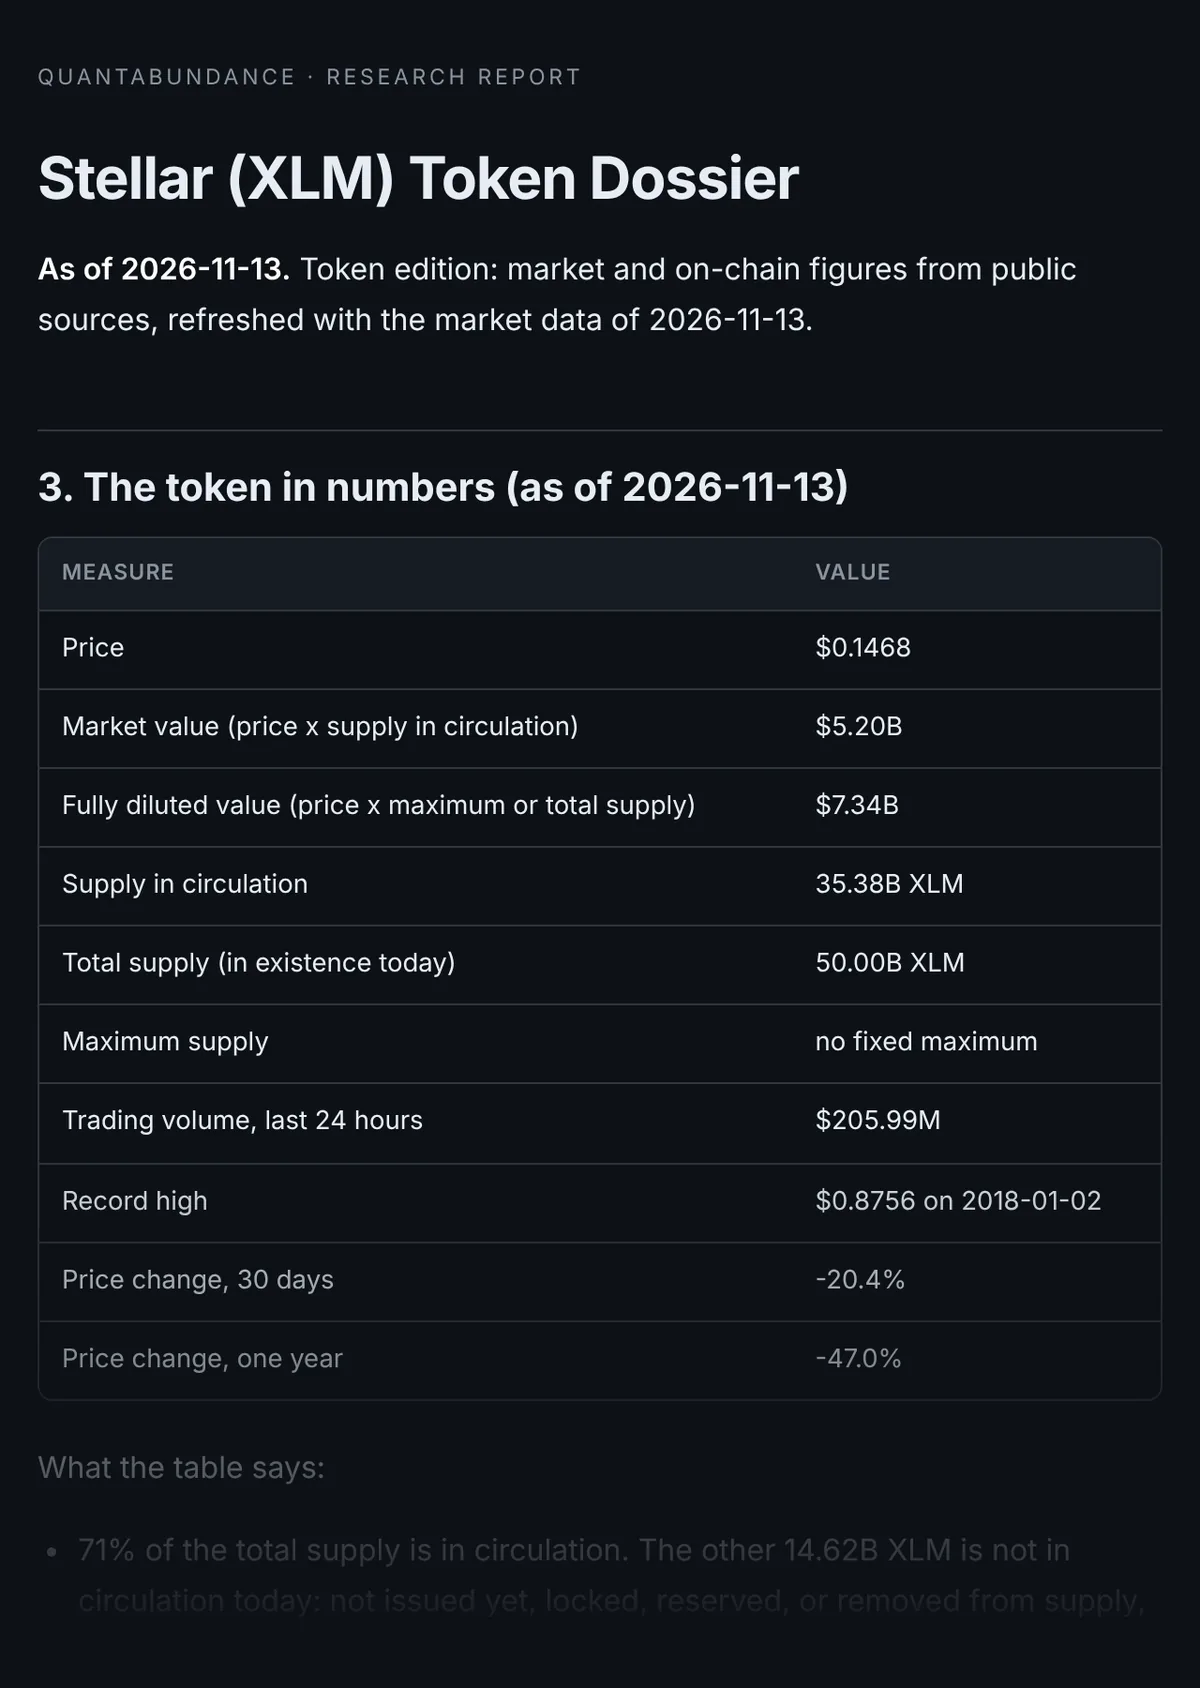
- 3. The token in numbers (as of 2026-11-13)
- 4. Fees and revenue of the protocol
- 5. The level map (as of 2026-11-13)
- 6. Sources
- 7. What this dossier cannot do
- More dossiers in this theme
Excerpt
1. The teardown
Written 2026-11-11, with prices as of 2026-11-11. Figures in this part are as the desk read them that day; parts 2 to 5 carry the numbers as of 2026-11-13.
The setup
Last quarter, $33.2 billion moved across Stellar, up 71% in three months. On DefiLlama's latest daily count, the whole network collected $737 in fees. The lumen, its coin, closed Tuesday at 14.5 cents, down 52% in a year. The answer is two small jobs and one large seller, and I will name the seller before the end.
What it is
It is a payments network, live since twenty fourteen, built to move dollars, euros and other assets as tokens. Banks and fund managers issue those tokens. Ten main validators agree on each ledger, and three joined last quarter, MoneyGram among them. Nobody mines lumens, and nobody is paid to validate.
The usage: q3 report
The usage, from the foundation's third quarter report. Total volume reached $33.2 billion. Stablecoin transfers were 25.1 billion of that, up 121% from the second quarter. Tokenized real world assets on Stellar reached $4.1 billion at quarter end. That is up 548% in a year. The tracker RWA dot x.y.z. now shows 4.6 billion. Those are mostly tokenized funds.
What it earns
Almost nothing, by design. The report puts the average transaction fee at about one hundredth of a cent. DefiLlama counts $30300 of fees in the past thirty days. Over the past year, about half a million dollars. And those fees do not go to validators or to holders. Stellar's own documentation says they collect in a locked account that nobody can use. The network's revenue is tiny, and nobody receives it.
One table from the document
4. Fees and revenue of the protocol
| Source | Fees, 30 days | Fees, one year | Revenue, 30 days | Revenue, one year |
|---|---|---|---|---|
| Stellar | $28.95K | $495.38K | $28.95K | $495.38K |
The preview stops here. The full document is delivered by email after purchase.
What the dossier has that the video does not
One dated table for the token: price, market value, fully diluted value, supply in circulation, total and maximum supply, volume and the record high, with a plain read of what the table says. Where a data provider tracks the protocol, its fees and revenue over 30 days and one year, and how many times annualised fees the token trades at, said as an estimate.
Kept current
The dossier carries an "as of" date. The tables are rebuilt on a regular schedule and the desk's daily check flags any dossier left more than 45 days without a refresh. The written teardown keeps its date, and a line says how far the price has moved since.
What is inside
- The teardown in writing: what the token is, who earns it, the weak points and the verdict, dated.
- What changed since it was written: the price then and now.
- The token in numbers: market value, fully diluted value, supply in circulation, total and maximum supply, with a plain read.
- Fees and revenue of the protocol over 30 days and one year, where a public data provider tracks them.
- The level map rebuilt from the latest price: the 52-week range and the 50 and 200-day averages.
- Sources: a link to every data page used.
Buy it if
- You hold or watch $XLM and want a structured read before acting.
- You want figures you can check yourself, not an opinion.
Skip it if
- You want a buy signal. A dossier explains and maps; it does not signal.
- You expect audited accounts. A token has none: the figures come from public data providers and are labelled as such.
How delivery works
Pay through Stripe, and the document arrives by email within seconds as a permanent link tied to your address. Read it in the browser or print it to PDF. Nothing to install, nothing recurring: a one-time purchase. Lost the email? Sign in to your library with the same address and it is there.
Included in Pro. See Pro
An educational research publication, not investment advice, trade signals, a managed account, or an advisory service. Nothing in it is a recommendation to buy or sell any security. See our disclosures.